Some days ago we received our first Surface Hub device for our headquarters in Bern. After using it for some days, we decided to order another one for our second office in Glattbrugg. Why? Because the device is absolutely amazing! My colleague Thomas Maurer already blogged about the first experience with our Surface Hub. In this post I will not go into any functional details of the device, but I will focus on how the Surface Hub can be monitored with OMS/Azure Log Analytics.
Setup The Environment
After unboxing and initial setup of the Surface Hub, you need to assign it an Exchange device account. With that the Surface Hub can be used as a resource mailbox so that you can add it to meetings to block it. Upcoming meetings where the Surface Hub will be part of will be visible from the Surface Hub start screen. You can easily join the meetings by just touching the appropriate meeting from the list. The Surface Hub will automatically connect to the meeting using Skype for Business.

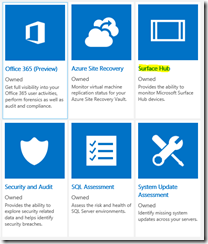
I will not cover the setup steps to prepare the Exchange mailbox, they are documented by Microsoft already here. But now let’s jump over to OMS. In Azure Log Analytics (microsoft.com/oms) you will find a solution in the gallery for monitoring Surface Hub devices. Adding a new solution is easy as 1-2-3, just add it and you are done, no configuration is needed. The solution defines what gets collected from the Surface Hub and visualize the collected data with a solution time and some views. Your global configuration settings can be used to collect additional data from the device. As this device runs Windows, the global configuration settings for collecting data from “Windows event logs” and “Windows performance counters” are also valid for Surface Hubs.
The Surface Hub is delivered with a preinstalled Microsoft Monitoring Agent. The only thing that needs to be done is connecting it to the appropriate OMS workspace. This can easily be accomplished by using the system settings and by entering your workspace id and workspace key. After a while, data will be collected and forwarded to Azure Log Analytics.
Basic Analytics
After a while the solution time will start showing information.
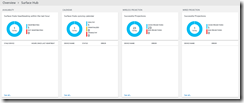
If you drill into the details of the solution, you will see four views that cover the most important aspects.
Availability
This area shows if your Surface Hub devices are actually heartbeating or not. This is the most important information the solution delivers. Because these devices are awesome, chances that they get stolen are very, very high ![]()
Calendar Sync
As mentioned, this is critical to join Skype for Business meetings with your Surface Hub device. Only if calendar syncing works, upcoming meetings will be visible on the start screen and let you join them.
Wireless Projections
Using Miracast, you can easily project the screen of your device to the Surface Hub and if needed share it with other meeting attendees. All successful and failed projections are reported in this view.
Wired Projection
I don’t know who would use this option, but if you do, successful and failed wired projections (e.g. using HDMI) will be shown here.
Advanced Analytics
Normally the information accessible from the solution views should be enough. However, you can dig deeper into the collected data. In the Log Search area you can see different data types collected for Surface Hub devices:
I will cover the most important ones here.
Perf
As a Surface Hub runs on Windows, lots of performance data gets collected. You can change the performance data that gets collected in the general configuration settings (Windows performance counters).
DeviceETW
This is the “Event Tracing for Windows” section that collect lots of different data from the device. Some events are:
- Heartbeat –> event generated every minute when device is online and on the network
- Cleanup –> shows start/stop of the session cleanup process
- ActiveSync –> start/stop or errors of ActiveSync calendar synchronizations
- Application information –> terminated applications/processes
- and much more …
Event
This is collected data from Windows event logs depending on the global configuration settings (Windows event logs).
Device Connect Session
This is information about wired and wireless projections from other devices.
With that base data available, you can start creating advanced queries to get and aggregate data as needed. Here is an example that will show the duration of projected sessions in minutes:
Type=DeviceConnectSession EventName=SessionAggregateEvent | EXTEND div(sessionDurationMilliSeconds, 60000) as SessionDurationMinutes | Select Computer,TimeGenerated,sessionClass,SessionDurationMinutes
Conclusion
The OMS solution for Surface Hubs is a nice and easy way to get some insights into your devices. Without big efforts you can easily identify the most important issues of a device and correct them (e.g. with the Log Analytics alerting option with auto-remediation). Especially in distributed environments with many Surface Hubs this might be very helpful.
I will play with the solution a bit more and post another article later.
Cheers
Marcel


Pingback: System Center Temmuz 2016 Bülten – Sertaç Topal