
If you are using Azure Front Door to optimize global access to your apps, you might recognize a lot of health probes in your app logs. This article explains what this means and why these are used.
A while ago I published a pretty popular article that explained the configuration of Azure Front Door. I explained how Front Door can be used to optimize your apps if you have a distributed, global consumer base. Azure Front Door sits out at the edge and allows app consumers to connect to the closest edge site to then get optimized app access through caching and Microsoft Global Network access (of course Front Door offers many more features such as DDOS protection, WAF etc., but I will not talk about these in this post). Front Door also offers a health probe option that allows the service to check if the apps (such as Web Apps) are available. It sends health probes to those backends on a regular basis. These probes are used to detect targets that are unhealthy so that Front Door can exclude them from the list of valid targets. You as an admin can decide, how health probes should be used and configured.
If you only have one active backend target, then health probes should be disabled.

When this configuration goes live, you will discover the health probes in the logs of your app. In this demo scenario, I use a simple web app that has diagnostics logging enabled. Events are forwarded to a Log Analytics workspace.


Now, when you analyze the AppServiceHTTPLogs table in Log Analytics, you will see tons of health probes coming in from Azure Front Door. Having a look at the TimeGenerated property will show, that the interval is much higher than the 240 seconds I configured.
AppServiceHTTPLogs

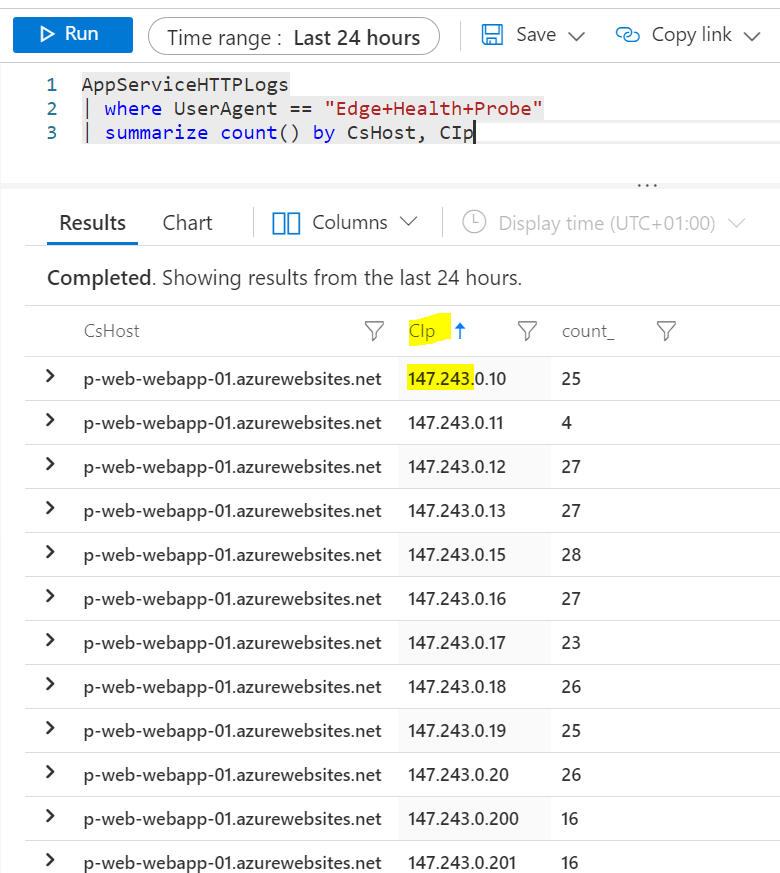
Digging a bit deeper you will see, that lots of different health probes will hit your web app from different source IP addresses (147.243.0.0/16). This is because health probes are sent from many different Front Door edge sites around the globe to find out the best backend based on health status and latency from each edge site.
AppServiceHTTPLogs
| where UserAgent == “Edge+Health+Probe”
| summarize count() by CsHost, CIp
Using the next query aggregates the health probes to a 240 seconds-window (my Front Door health probe interval). This shows that in each window my App receives approx. 160 health probes.
AppServiceHTTPLogs
| where CsHost == “p-web-webapp-01.azurewebsites.net”
| where UserAgent == “Edge+Health+Probe”
| summarize count() by bin(TimeGenerated, 240s)
| render timechart

Conclusion: Keep in mind that setting the health probe interval does not mean that you will only get one health probe in that time window, but many more from the different Front Door edge sites. To keep your logs clean but you can still ensure unhealthy backends are detected in a timely manner, think what interval makes sense for you and also think about disabling it completely if you only have one active backend – because for that case it has no real value.
Cheers
Marcel


